Central African Republic Planning Map
United Nations Geospatial Information Section (UNGIS) |
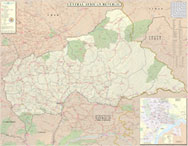 |
| Planning maps are produced by UNGIS for the use by peacekeeping planning, military and logistical officers when peacekeeping missions are being planned, set-up and Blue Helmets deploy. This map was p |
|
|
Central African Republic Profile Map
United Nations Geospatial Information Section |
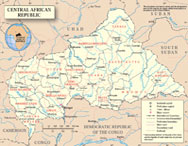 |
| Country profile maps are produced by UNGIS for the use by United Nations Secretariat staff who may want to include a map in their reports or briefing. This map was revised in the anticipation of the |
|
|
Newtown Planning Proposal, 1968
Anthonia Ijeoma Onyeahialam |
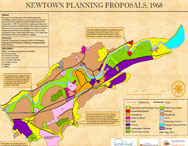 |
| This is a redrawn map of land use planning proposals for Newtown Powys as set out in the town planning map No 7 which was initially prepared by the Mid Wales Development Corporation in 1968. |
|
|
|
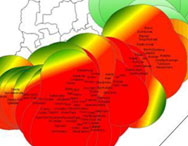
UK Global Wool Assemblages
Anthonia Ijeoma Onyeahialam |
 |
| Key Times Series Patterns of UK Wool Exports |
|
|
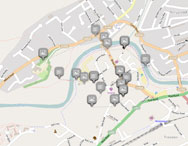
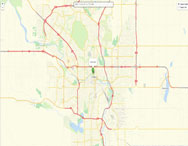
Origin -Destination graph – City Lombardy
pjhooker |
 |
| This map, allows navigation through the city and dynamically display traffic sources with cars during rush hour. |
|
|
World Census
Jihoon Son |
 |
| This Web Map displays world population data from U.S. Census Bureau API that includes age distribution, mortality rate, and others using leaflet, D3, and geojson. |
|
|
|
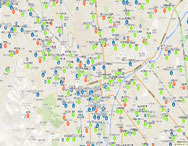
Jeju Island Floating Population Present Condition Time Series Map.
Pinogio Team of Mango System Inc. |
|
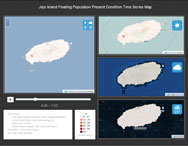 Using public data to check on the status of the Jeju Island (in South Korea) floating population in time-series data. You can check the floating population by weather. Using public data to check on the status of the Jeju Island (in South Korea) floating population in time-series data. You can check the floating population by weather. |
|
|
MapOnShirt.com
Martins Linde |
 |
| MapOnShirt is a tool for creating designs from abstract maps. GeoServer, OL3, PostGIS and OSM data are some of technologies which made this possible. Thanks to open source GIS contributors. |
|
|
China Air Quality Map, 2014
WEI LU |
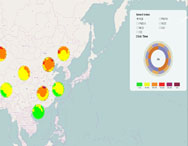 |
| Interactive web mapping of Air Quality of cities in China |
|
|
|
Zero of water meter freeze
Seoul’s Policy Supporting Map |
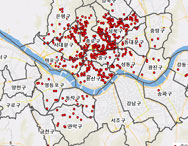 |
| Identify correlations in accordance with the minimum temperature and housing types mapped by geocoding based on service pipe freezing and the freezing point of water meters (address) |
|
|
Globo Terrestre by Giovanni Maria Cassini
Jerome St-Louis |
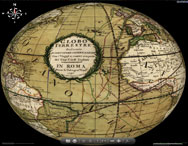 |
| Cassini’s terrestrial globe from 1790 (produced by GNOSIS) |
|
|
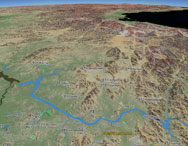
Seoul from Above
Jerome St-Louis |
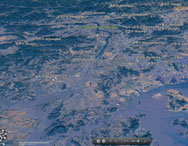 |
| Topography, LANDSAT-8 satellite imagery and street map data around Seoul (produced with GNOSIS) |
|
|
|
Top of the World
Jerome St-Louis |
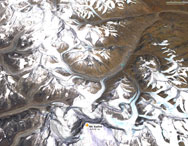 |
| Topography and LANDSAT-8 satellite imagery around Mt. Everest (produced with GNOSIS) |
|
|
Topography and Land Coverage of New Zealand
Jerome St-Louis |
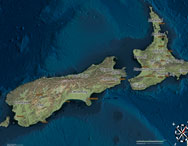 |
| Topography and land coverage of New Zealand (produced with GNOSIS) |
|
|
Relief of Seoul
Jerome St-Louis |
 |
| Topography, LANDSAT-8 satellite imagery and street map data around Seoul (produced with GNOSIS) |
|
|
|
Globe View of Seoul
Jerome St-Louis |
 |
| A globe view of topography and street map data around Seoul (produced with GNOSIS) |
|
|
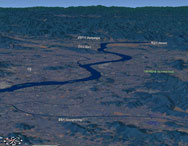
A View of Seoul
Jerome St-Louis |
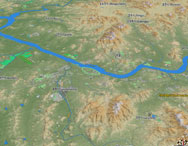 |
| Topography and street map data around Seoul (produced with GNOSIS) |
|
|
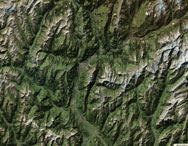
Mountains and Lochs in North West British Columbia
Jerome St-Louis |
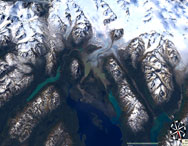 |
| Satellite imagery and topography in North West British Columbia (produced with GNOSIS) |
|
|
|
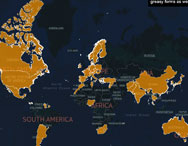
Global Remittances Pattern to Nigeria
Anthonia Ijeoma Onyeahialam |
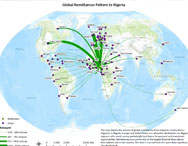 |
| The map depicts the volume of global remittances from migrants, mainly labour migrants to Nigeria. |
|
|
Assembling Newtown: A story of Newtown, Powys County, UK
Global Rural Project Team |
 |
| A story map of images, memoirs, videos and maps narrating the everyday globalisation story of the largest town in Midwales, UK |
|
|
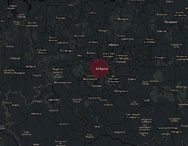
CURTAILING FLOOD DISASTER IN RIVERINE COMMUNITIES IN ABUJA (NIGERIA) WITH GIS
Miss Joseph Nancy Nakup |
 |
| Flood buffer communities in Abuja, Nigeria |
|
|
|
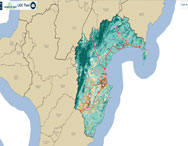
Assessment of Flood in Nigeria
Rotdunna Kassem |
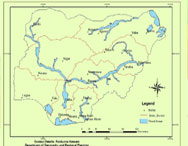 |
| Floods and other extreme weather and climate events are often accompanied by loss of lives and property, damage to crucial infrastructure, disruption of socio-economic activities and in some cases dis |
|
|
Cape Peninsula
Jerome St-Louis |
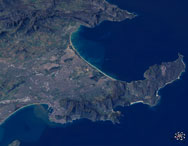 |
| A 3D view of the Cape Peninsula in South Africa with LANDSAT-8 satellite imagery (produced with GNOSIS) |
|
|
Korea from above
Jerome St-Louis |
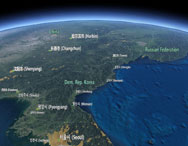 |
| A 3D globe view of Korea and its surroundings (produced with GNOSIS) |
|
|
|
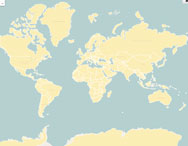
Making tactile map for blind people
Making tactile map for blind people |
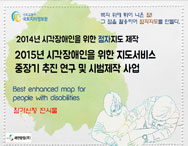 |
| Tactile map aims to spread right geographic data, and it is produced by national agencies for blind people. |
|
|
Typhoon Realtime Watcher
Hidenori Watanave |
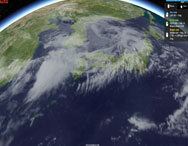 |
| “Typhoon Realtime Watcher” is a realtime mashup of the typhoon information by the Japan Meteorological Agency and disaster information on the social media. This is the web service which combines “bott |
|
|
POI Finder
Ebrahim Poorazizi |
 |
| POI Finder: find attractions at your footprint |
|
|
|
WalkYourPlace
Ebrahim Poorazizi |
 |
| WalkYourPlace: an urban accessibility assessment tool |
|
|
Sapporo Childcare Map
Code for Sapporo |
 |
| The map covers childcare and kindargarten located in the city of Sapporo to help parents to find ones that meet their needs. http://www.sapporosmile.com/projects/code-for-sapporo/?lang=en |
|
|
Scene of Tianjin Explosions
Yu Lou |
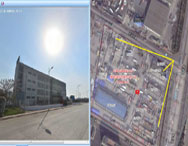 |
| This accident map is composed of aerial photographs and satellite images |
|
|
|
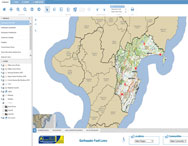
Hawke’s Bay Land Use Class (LUC) Tool
Simon Nitz |
 |
| An interactive map based tool to easily identify Land Use Classes and Soil information for a selected land parcel. |
|
|
HB Viewer
Simon Nitz |
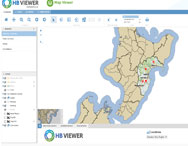 |
| HB Viewer provides access to spatial tools, data and web services to provide better communication and decision making without necessarily the need for specialist GIS skills. |
|
|
Hawke’s Bay Hazard Information Portal
Joanne O’Brien |
 |
| The Hawke’s Bay Hazard Information Portal aims to make information on the nature and location of hazards more accessible, to assist people and organisations make better risk management decisions |
|
|
|
Fluid Geographies of the Coastal Megacity
Tomas Holderness |
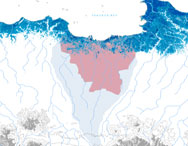 |
| The conflict of water in the world’s second largest megacity; downstream flow collides with the subsiding metropolis, 40% of which is already below sea level. |
|
|
Elastic Terrain Map
Jonas Buddeberg |
 |
| Experience the third dimension of terrain how you have never before. Based on OpenLayers 3 WebGL renderer. Data from public sources, preprocessed with QGIS, GDAL, Tilers-Tools. Best in Google Chrome. |
|
|
Elastic Terrain Map
Jonas Buddeberg |
|
| Experience the third dimension of terrain how you have never before. Based on OpenLayers 3 WebGL renderer. Data from public sources, preprocessed with QGIS, GDAL, Tilers-Tools. Best in Google Chrome. |
|
|
|
The Digital Archive of the Battle of Okinawa 1945
Hidenori Watanave |
 |
| The innumerable war survivor’s movement and the distribution of war dead are visualized by this archive, so users can feel the real situation of the war disaster by “movements” of people. |
|
|
Hiroshima Archive
Hidenori Watanave |
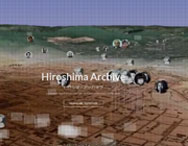 |
| “Hiroshima Archive” is a pluralistic digital archive using the digital globe “Cesium” to display on it in a multilayered way all the materials gained from many sources of the Hiroshima Atomic Bomb. |
|
|
|
|